The official (and always current) docs for monitoring Anka Build Cloud are at https://docs.veertu.com/anka/anka-build-cloud/monitoring/. This post is one worked example built on top of them.
Run a fleet of Macs for iOS or macOS CI long enough and a disk will fill up. Then everything stops. A node that can’t pull a template rejects jobs, and a registry with no room blocks new tags. You want those signals in the same place you already watch CPU and queue depth: Prometheus for scrape and storage, Grafana for panels and alerts.
What a full node does to the fleet
A full Anka node is one of the classic ways a Build Cloud fleet breaks. The Controller agent logs rejecting due to lack of disk space when it cannot pull the template a job needs. While it frees space by deleting least-used templates, it also stops taking new tasks during the pull. Two large templates that cannot both fit can leave a node thrashing between pulls and doing nothing useful for other jobs.
The Controller UI won’t warn you that disk is getting tight, so you need something else: a time series per node, and an alert that fires before free space hits zero.
Why disk is the worked example
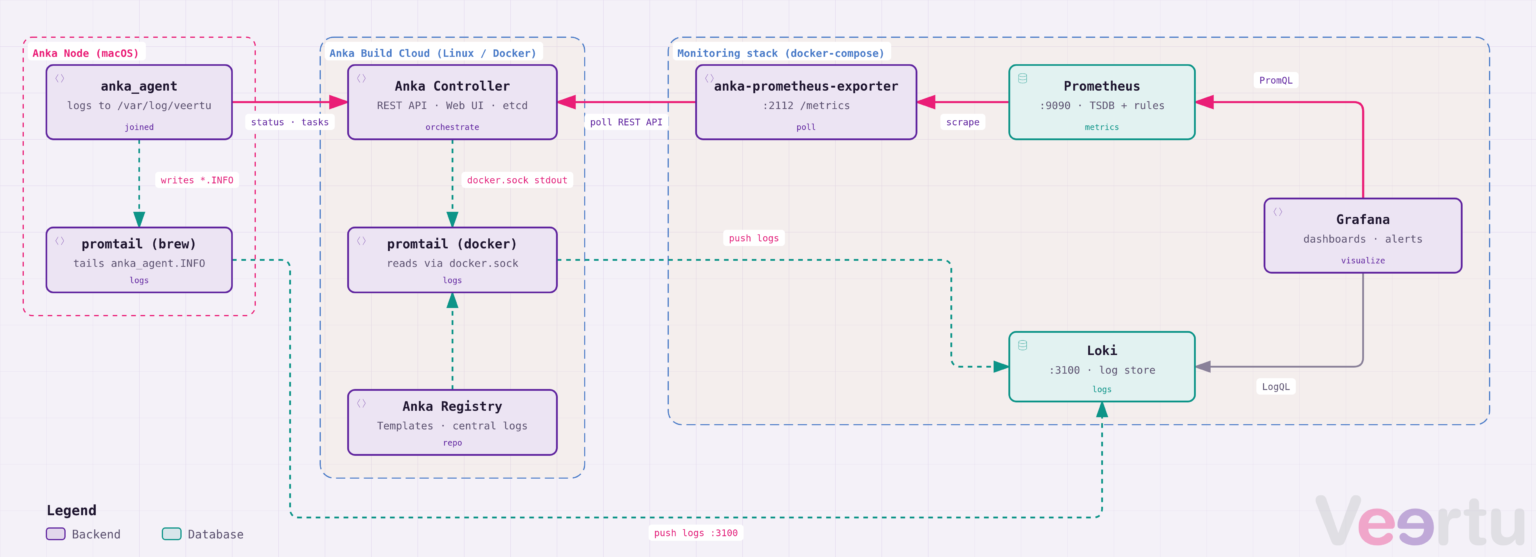
Anka Build Cloud does not expose Prometheus metrics from the Controller by itself. You run the Anka Prometheus Exporter, which polls the Controller and serves /metrics. Three of its node metrics map directly to disk planning:
| Metric | What it reports |
|---|---|
anka_node_disk_free_space | Free disk on the node, in bytes |
anka_node_disk_total_space | Total disk on the node, in bytes |
anka_node_disk_anka_used_space | Disk used by Anka on the node, in bytes |
The same shape exists at group and fleet level (anka_node_group_disk_*, anka_nodes_disk_*) and for the Registry (anka_registry_disk_free_space, anka_registry_disk_used_space, plus per-template usage). Start with disk. The failure mode is well documented and the metrics leave no room for interpretation.
How Anka exposes the metrics
Our official Monitoring documentation recommends Grafana for visualization, Prometheus for metrics, and Loki if you also want logs. For metrics specifically:
- Run Prometheus (Docker is fine).
- Run
anka-prometheus-exporterpointed at your Controller. - Add the exporter as a scrape target to Prometheus.
- Point Grafana at Prometheus and import or build dashboards.
The exporter accepts --controller-address (or ANKA_PROMETHEUS_EXPORTER_CONTROLLER_ADDRESS). Default listen address is :2112. It supports TLS to the Controller, client certs, root-token basic auth, and UAK auth when your Controller has advanced security enabled.
Veertu’s getting-started repo ships helper scripts under PROMETHEUS/ for a local Docker Prometheus and for installing the exporter on a Mac.
Set up a scrape
Point the exporter at your Controller (adjust the URL and auth for your environment):
./anka-prometheus-exporter --controller-address http://anka.controllerOr, using the getting-started helper (edit the script if your Controller is not at http://anka.controller):
cd getting-started
./PROMETHEUS/install-and-run-anka-prometheus-on-mac.bash
Add a scrape job to prometheus.yml:
scrape_configs:
  - job_name: "anka build cloud"
    static_configs:
      - targets: ["host.docker.internal:2112"]
Use host.docker.internal:2112 when Prometheus runs in Docker on the same Mac as the exporter. On Linux Docker hosts, use 172.17.0.1:2112 instead.
When the exporter starts it logs two JSON lines (v4.x uses Go’s slog; set LOG_LEVEL=debug to also see every Controller request):
{"time":"2026-09-21T14:02:11.482-05:00","level":"INFO","msg":"Starting Prometheus Exporter for Anka (v4.3.2)"}
{"time":"2026-09-21T14:02:11.486-05:00","level":"INFO","msg":"Serving metrics at :2112/metrics"}
Check the disk metrics are there before you touch Prometheus. Example output for a two-node Apple silicon fleet (the Go client sorts labels alphabetically and prints bytes in exponent form):
$ curl -s http://127.0.0.1:2112/metrics | grep anka_node_disk_
# HELP anka_node_disk_anka_used_space Amount of disk space used by Anka on the Node in Bytes
# TYPE anka_node_disk_anka_used_space gauge
anka_node_disk_anka_used_space{arch="arm64",id="7f3c9a2e-5b1d-4e8f-9c6a-2d4b8e1f0a37",name="mac-mini-01",state="Active"} 1.187603234816e+12
anka_node_disk_anka_used_space{arch="arm64",id="c41e77b0-9d2a-4f6c-8e3b-5a7d1c9f2e84",name="mac-mini-02",state="Active"} 1.73920538624e+12
# HELP anka_node_disk_free_space Amount of free disk space on the Node in Bytes
# TYPE anka_node_disk_free_space gauge
anka_node_disk_free_space{arch="arm64",id="7f3c9a2e-5b1d-4e8f-9c6a-2d4b8e1f0a37",name="mac-mini-01",state="Active"} 6.12386725888e+11
anka_node_disk_free_space{arch="arm64",id="c41e77b0-9d2a-4f6c-8e3b-5a7d1c9f2e84",name="mac-mini-02",state="Active"} 7.8114553856e+10
# HELP anka_node_disk_total_space Amount of total available disk space on the Node in Bytes
# TYPE anka_node_disk_total_space gauge
anka_node_disk_total_space{arch="arm64",id="7f3c9a2e-5b1d-4e8f-9c6a-2d4b8e1f0a37",name="mac-mini-01",state="Active"} 1.99466293248e+12
anka_node_disk_total_space{arch="arm64",id="c41e77b0-9d2a-4f6c-8e3b-5a7d1c9f2e84",name="mac-mini-02",state="Active"} 1.99466293248e+12
After the first scrape the same series appear in the Prometheus UI with instance and job labels added. anka_node_disk_free_space in the Table view:
anka_node_disk_free_space{arch="arm64", id="7f3c9a2e-5b1d-4e8f-9c6a-2d4b8e1f0a37", instance="host.docker.internal:2112", job="anka build cloud", name="mac-mini-01", state="Active"}    612386725888
anka_node_disk_free_space{arch="arm64", id="c41e77b0-9d2a-4f6c-8e3b-5a7d1c9f2e84", instance="host.docker.internal:2112", job="anka build cloud", name="mac-mini-02", state="Active"}    78114553856
mac-mini-02 has 78 GB free. If its largest template is 80 GB, the next pull fails and the agent starts deleting least-used templates on that node. That is the machine the rest of this post alerts on.
Grafana panel: free disk per node
In Grafana, add Prometheus as a data source, then create a time-series panel:
- Query:
anka_node_disk_free_space - Legend:
{{name}}(node name label from the exporter) - Unit: bytes (IEC)
- Optional second query:
anka_node_disk_anka_used_spaceon the same panel to see Anka’s share of the disk climb as templates accumulate
A useful derived panel for capacity planning:
anka_node_disk_free_space / anka_node_disk_total_spaceSet the unit to percent. A dropping free ratio is the early warning; absolute free bytes is what you alert on once you know your largest template size.
Veertu also publishes an example Grafana dashboard JSON in the Monitoring docs. Import that after Prometheus and Loki are wired, then trim to the panels you care about.
On the two example nodes, mac-mini-01 draws as a near-flat line around 570 GiB. mac-mini-02 is a sawtooth: each new template tag pulled steps the line down, each least-used-template cleanup by the agent steps it back up. A sawtooth whose peaks trend down over days is the pattern to watch. Export the dashboard JSON once the panel looks right so it survives a Grafana rebuild.
Metrics that matter for capacity planning
Beyond disk, these are the exporter metrics we’d put on a fleet health row:
| Metric | Why it matters |
|---|---|
anka_node_instance_capacity / anka_node_instance_count | Slots available vs in use on each node |
anka_nodes_instance_capacity / anka_nodes_instance_count | Same view across the fleet (capacity label includes arch) |
anka_node_cpu_util / anka_node_ram_util | Host saturation while VMs run |
anka_node_states | Node connectivity / state changes vs the Controller |
anka_instance_state_count | Instances stuck in Error or other bad states |
anka_registry_disk_free_space | Registry headroom for new tags |
anka_registry_template_disk_used | Which templates dominate registry storage |
Full metric list: Exposed Metrics in the exporter README.
Ship node logs to Loki
Metrics tell you a disk is filling. Logs tell you what the agent did about it. The Monitoring docs cover Loki and promtail in full; this is the short version for a macOS node. Install promtail with Homebrew, then edit the config it created ($(brew --prefix)/etc/promtail-local-config.yaml) so it tails the agent log and pushes to your Loki:
clients:
  - url: http://grafana.mydomain.com:3100/loki/api/v1/push

scrape_configs:
  - job_name: system
    static_configs:
      - targets: [localhost]
        labels:
          job: mac-mini-02
          __path__: /var/log/veertu/*.INFO
    pipeline_stages:
      - multiline:
          firstline: '^{'
          lastline: '^}'
          max_wait_time: 3s
      - json:
          expressions:
            output_field: message
Set job to the node’s hostname so it lines up with the name label from the exporter, then brew services start promtail. The agent writes one JSON object per entry, which is why the multiline stage is there. On the Build Cloud host, run promtail in Docker with docker_sd_configs instead; it picks up Controller, Registry, and etcd stdout without any file paths. That config is in the same docs page.
Add Loki as a second data source in Grafana. The query that matches alert item 4 below, for the node from the metrics example:
{job="mac-mini-02"} |= "rejecting due to lack of disk space"To turn it into an alert, count matches over the hour and threshold it. This works as a Grafana alert rule or in the Loki ruler:
sum by (job) (count_over_time({job=~"mac-mini-.*"} |= "rejecting due to lack of disk space" [60m])) > 3Pair the two. AnkaNodeDiskLow fires while there is still time to add a node or trim a template. The log alert fires once the agent has already started rejecting work.
What to alert on
Start from the Monitoring recommendations, then add disk thresholds tied to your largest template:
- Fleet free capacity at zero for more than 15 minutes: you need more nodes (or fewer concurrent starts). The
AnkaFleetNoFreeCapacityrule below covers it. - Registry free space under ~70GB: keep registry free space at 50GB or more; alert before you get there.
- Node free disk below your largest template (plus pull headroom): use
anka_node_disk_free_space. If a template needs 80GB to pull cleanly, alert at 100GB free, not at zero. - Agent log patterns (via Loki/promtail if you collect
/var/log/veertu): more than threerejecting due to lack of disk spaceevents in 60 minutes, or more than threecan't start vmevents in 20 minutes.
Prometheus alert rule sketch for node disk (tune the threshold):
groups:
  - name: anka-disk
    rules:
      - alert: AnkaNodeDiskLow
        expr: anka_node_disk_free_space < 107374182400
        for: 10m
        labels:
          severity: warning
        annotations:
          summary: "Anka node {{ $labels.name }} free disk under 100 GiB"
Against the example fleet this rule fires for mac-mini-02 after the 10 minute hold. In the Prometheus UI, ALERTS{alertname="AnkaNodeDiskLow"} returns:
ALERTS{alertname="AnkaNodeDiskLow", alertstate="firing", arch="arm64", id="c41e77b0-9d2a-4f6c-8e3b-5a7d1c9f2e84", instance="host.docker.internal:2112", job="anka build cloud", name="mac-mini-02", severity="warning", state="Active"} 1The rendered annotation reads Anka node mac-mini-02 free disk under 100 GiB. Route it through Alertmanager or Grafana alerting to wherever your on-call lives.
For the capacity-at-zero alert, remember that anka_nodes_instance_capacity is split by arch since exporter v3 (Controller 1.22.0 or newer), so sum it before comparing:
      - alert: AnkaFleetNoFreeCapacity
        expr: sum(anka_nodes_instance_capacity) - anka_nodes_instance_count == 0
        for: 15m
        labels:
          severity: warning
        annotations:
          summary: "No free Anka instance slots for 15 minutes"
When to use this stack
Prometheus + the Anka exporter is the right default if you already run Prometheus, or if you want fleet-wide disk and capacity history without building a custom Controller poller. It is overkill for a single Mac with one VM. In that case the Controller UI and node logs are enough. If you only need failure signals and not graphs, central logs plus the recommended log alerts will carry you until the fleet grows.
Versions behind the examples
The log and metric formats shown here are from anka-prometheus-exporter v4.3.2 against Anka Build Cloud Controller 1.51.1, with Prometheus in Docker on the same Mac as the exporter. Node names, UUIDs, and byte counts are illustrative. Your label set will match if you run exporter v3 or newer.