monitoring-build-cloud-with-promtheus-and-grafana

Monitoring your Anka Build Cloud with Prometheus

Prometheus is a powerful monitoring and alerting toolkit. You can use it to store Anka Controller, Registry, and VM metrics to build out or integrating into existing graphing tools like Grafana.

While exactly how you should install Prometheus and Grafana are outside of our bounds of support, we do have a way to set it up locally (using docker), connect it to your Build Cloud Controller, and start playing around on your machine. The script you can run to achieve this can be found on our Getting Started Github Repo.

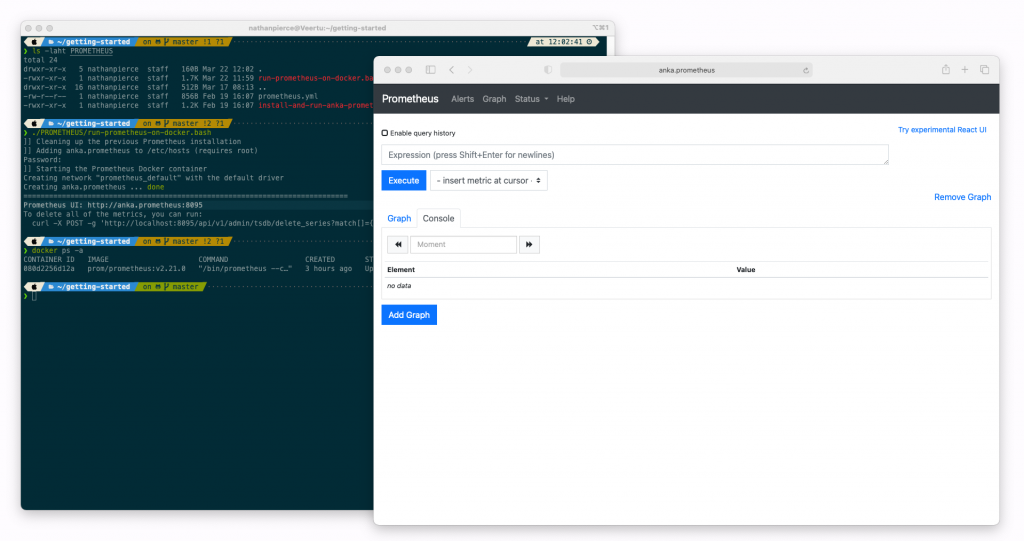
Once the getting-started repo is cloned into your local machine, you need to start a docker container with Prometheus. Execute the run in docker script:

cd getting-started && ./PROMETHEUS/run-prometheus-on-docker.bash

Once running, visit the url and port it created for you (shown in the output of the script)

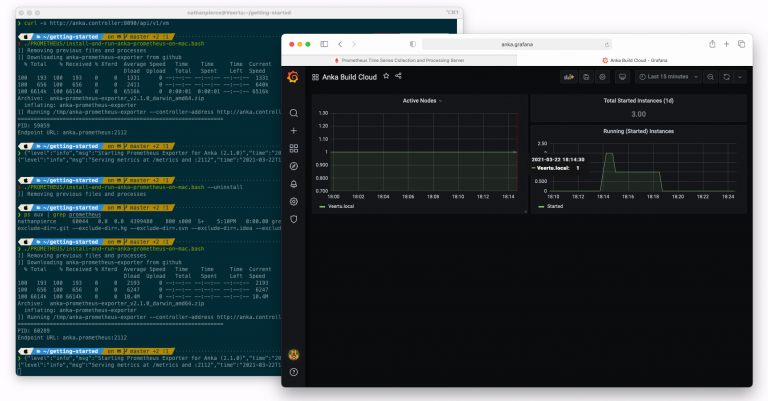
Prometheus does not collect metrics from the Anka Build Cloud by default. You’ll need to run the Anka Prometheus Exporter for that. Use the Getting Started Github Repo script for this:

❯ ./PROMETHEUS/install-and-run-anka-prometheus-on-mac.bash
]] Removing previous files and processes
]] Downloading anka-prometheus-exporter from github
  % Total    % Received % Xferd  Average Speed   Time    Time     Time  Current
                                 Dload  Upload   Total   Spent    Left  Speed
100   193  100   193    0     0   1331      0 --:--:-- --:--:-- --:--:--  1331
100   656  100   656    0     0   2429      0 --:--:-- --:--:-- --:--:--  2429
100 6614k  100 6614k    0     0  7440k      0 --:--:-- --:--:-- --:--:-- 7440k
Archive:  anka-prometheus-exporter_v2.1.0_darwin_amd64.zip
  inflating: anka-prometheus-exporter
]] Running /tmp/anka-prometheus-exporter --controller-address http://anka.controller:8090 and backgrounding the process
================================================================
PID: 2323
Endpoint URL: anka.prometheus:2112
❯ {"level":"info","msg":"Starting Prometheus Exporter for Anka (2.1.0)","time":"2021-03-22T15:19:17-04:00"}
{"level":"info","msg":"Serving metrics at /metrics and :2112","time":"2021-03-22T15:19:17-04:00"}

This will run the exporter in the background (it will not be available after you reboot your machine and you’ll have to re-run the script). The exporter is set up, by default, to connect to http://anka.controller:8090 and your controller may not be running at this URL and port. Feel free to modify the script!

Next, you’ll want to confirm that the metrics are now available in Prometheus:


Once you’ve confirmed the metric are available, you can now use the built-in graph and alerting for several metrics. For example, anka_node_states to see when Node connectivity to the controller fails, anka_instance_state_count to see when instances are throwing errors, anka_node_cpu_util to trigger alarms when VMs are crippling the Node, and much more. A full list of metrics is available at https://github.com/veertuinc/anka-prometheus-exporter#exposed-metrics.

We won’t go into depth with setting up Grafana as it’s already covered on https://grafana.com/docs/grafana/latest/getting-started/getting-started-prometheus/.

Grafana will need to connect to the host and port for Prometheus. This is available at http://host.docker.internal:8095 if you used the scripts in the Getting Started repo.

Share this post

networking-performancev1
Unlocking Superior macOS VM Network Performance: Introducing Anka's new networking mode for Apple Silicon
Large and complex enterprises using Anka have many different demands, and we have worked to continue to develop innovative technology to meet these demands. Enterprise infrastructure hardware is often on the cutting edge, and they need advanced capabilities...
Read More
gitlab-with-anka
Anka Cloud Gitlab Executor
Veertu’s Anka and the new Anka Cloud Gitlab Executor Veertu’s Anka is a suite of software tools built on the macOS virtualization platform. It enables the execution of single or multi-use macOS virtual machines (VMs) in a manner similar to Docker....
Read More
mac-scan-v1
Real-Time CVE Scanning of your macOS Build Systems
It’s common that an organization’s macOS build system will download thousands, sometimes tens of thousands of third-party dependencies every hour. When building and testing iOS applications, it typically downloads and installs third-party...
Read More
anka-on-silicon-v1
The ONLY Fully Automated Apple Silicon macOS VM Creation Solution
Starting in Anka 3.1 we announced that Anka is now able to fully automate the macOS installation processes, disabling SIP, and enabling VNC — all previously manual steps users had to perform inside o the VM. At the time of writing this article,...
Read More
anka_click
Scripting macOS UI User Actions With Anka Click
Starting in Anka 3.2, we’ve introduced a solution for scripting macOS UI user actions. You may ask, “Why would I want to do that?”. Well, often macOS configuration and applications do not have a CLI allowing you to perform certain actions...
Read More
mac-scan-fullscan-shells-v3
Real-time, continuous scan of file downloads on macOS for security vulnerabilities
Today, we are announcing the Beta availability of the Mac Scan solution. Mac Scan software runs on macOS systems (bare metal, virtual, EC2 Mac) and scans downloads in real time for security vulnerabilities. There are multiple scenarios why you would...
Read More
Screen Shot 2022-10-17 at 10.13
Anka 3.1- Fully automated VM macOS installation & The Behavior-Driven macOS UI Automation Framework
We are very happy to announce the General Availability of Anka 3.1 for Apple Silicon / ARM macs. In this release, we are taking our approach to iOS CI automation one step further by introducing a Behavior-Driven macOS UI Automation Framework in Anka,...
Read More
ankam1v2
Migrating from Anka on Intel to Anka on M1 Mac for iOS CI
In this blog, we will cover the key topics for migrating from Anka on Intel to Anka on M1/M2 Macs. Anka is an IaaC solution from Veertu to set up an agile Container like CI for iOS CI using macOS VMs. Anka for Intel uses Apple’s Hypervisor.Framework virtualization...
Read More
ami-scanner-featured-v2
World's first Security Vulnerability scanner for EC2 Mac AMIs
We are excited to announce the General Availability of the world’s first security vulnerability scanner for EC2 Mac AMIs. EC2 Mac AMI Scan scans Intel and Apple Silicon macOS EC2 AMIs, detects security vulnerabilities in third-party packages, dependencies,...
Read More
esxi-to-anka
It's time to migrate your iOS CI from ESXi Virtual Mac Infrastructure to native macOS Virtualization
When VMWare ESXi started officially supporting Apple macOS Virtualization on Mac hardware in late 2012, it opened the doors for the possibility of iOS development to move to a Linux-like, agile, scalable CI infrastructure. Soon enough, many iOS enterprise...
Read More